






Missing Data Hid 49% Spike in Delhi's Diwali Pollution: CREA
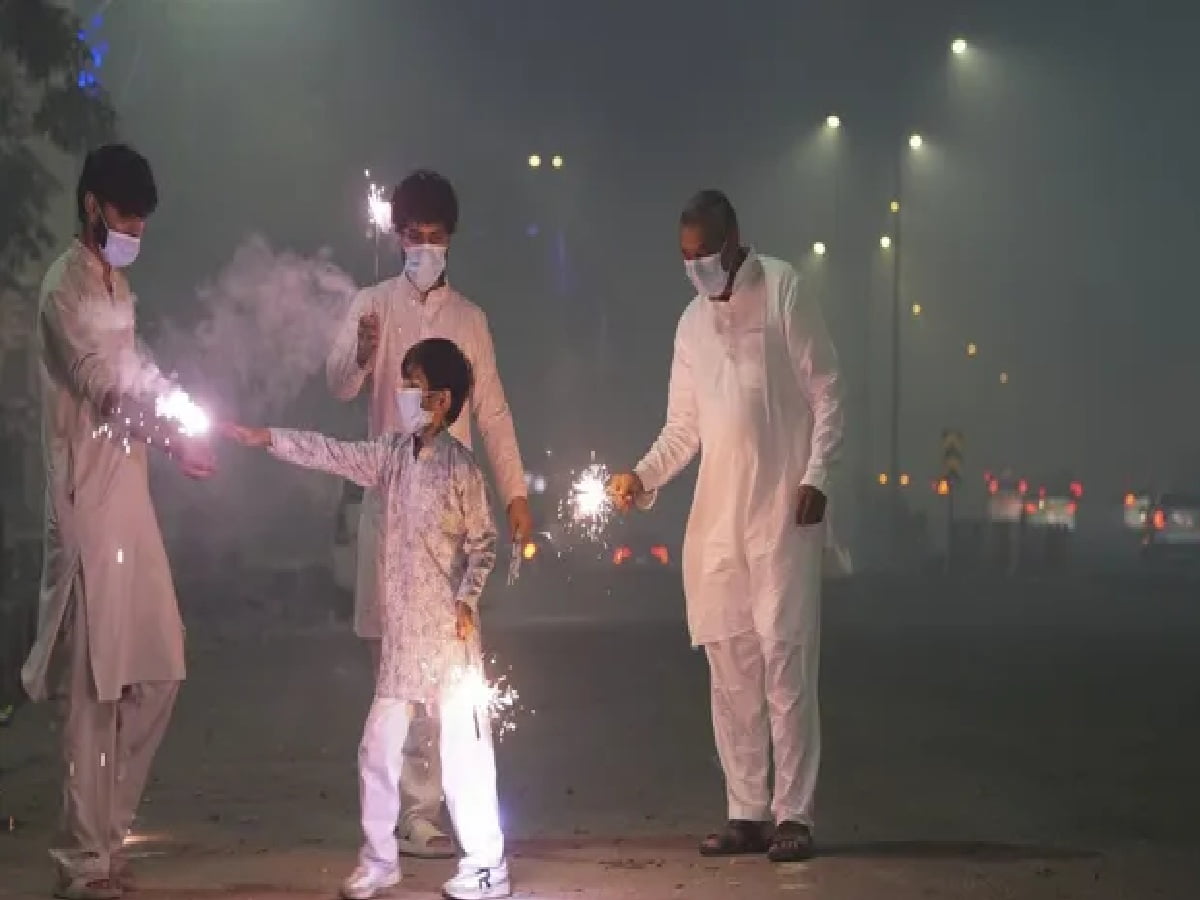
A startling new environmental assessment has revealed that the true scale of toxic air pollution blanketing the National Capital Region during Diwali celebrations was significantly understated in official bulletins due to widespread data blackouts across air quality monitoring stations. According to an independent analysis released on Thursday, November 12, 2026, by the Centre for Research on Energy and Clean Air (CREA), Delhi’s average fine particulate matter (PM2.5) concentration on Diwali could have been up to 49 percent higher than officially reported. The gap stems from hundreds of missing hourly readings during peak firecracker bursting hours on the night of November 8 and early morning of November 9. CREA’s modeling indicates that if the missing station-hour readings had been recorded at the Central Pollution Control Board’s (CPCB) upper calibration ceiling of 1,000 micrograms per cubic metre (µg/m³), Delhi’s 24-hour average PM2.5 level would have surged from 269 µg/m³ to 400 µg/m³. Such a jump would have pushed the capital's overall Air Quality Index (AQI) on Monday from 344 in the "very poor" bracket straight to the threshold of the hazardous "severe" category, raising urgent questions about environmental data transparency across Delhi, Noida, Ghaziabad, and Gurugram.
Inside the CREA Report: How 255 Missing Readings Altered Delhi's AQI
To evaluate the statistical impact of post-Diwali data blackouts, researchers at the Centre for Research on Energy and Clean Air audited the raw hourly PM2.5 dataset across Delhi’s air quality network. While the Central Pollution Control Board aggregates data from 60 continuous ambient air quality monitoring stations across the capital, one station has remained non-operational for several months, leaving 59 active stations. CREA examined every expected hourly entry across these 59 stations between 4:00 PM on Sunday, November 8, and 4:00 PM on Monday, November 9—the exact 24-hour window used to compute the CPCB’s official November 9 daily AQI bulletin.
Out of a total of 1,416 expected station-hour data points (59 stations multiplied by 24 hours), exactly 255 hourly observations—representing 18 percent of the entire dataset—were missing from public dashboards. To measure how severely these omissions skewed the citywide average, CREA conducted a structured sensitivity analysis by substituting each of the 255 missing entries with 1,000 µg/m³, the maximum threshold CPCB sensors are configured to report. Under this scenario, Delhi’s pooled 24-hour average PM2.5 concentration climbed from 269 µg/m³ to 400 µg/m³, marking a 49 percent escalation. Even without accounting for the missing gaps, the reported 269 µg/m³ figure was more than four times India’s national daily permissible limit of 60 µg/m³ and nearly eighteen times the World Health Organization (WHO) safe guideline of 15 µg/m³.
Hourly Nighttime Peaks: What Happened Between Midnight and 3 AM
The distortion caused by missing data becomes even more pronounced when examining hour-by-hour pollution trajectories during the peak festive night. Based solely on incomplete public datasets where dozens of stations went offline during late-night hours, Delhi’s citywide hourly PM2.5 average appeared to peak at 584 µg/m³ at 1:00 AM on November 9. However, once CREA populated the missing station entries with the 1,000 µg/m³ ceiling value, the citywide hourly peak shifted later into the night and escalated sharply, reaching 825 µg/m³ at 2:00 AM and remaining at 824 µg/m³ at 3:00 AM.
CREA analysts clarified that their sensitivity analysis is designed as an illustrative stress test rather than definitive proof that every single one of the 255 missing data points exceeded 1,000 µg/m³. Some stations may have experienced routine telemetry dropouts or maintenance lags. Nevertheless, because the overwhelming majority of data blackouts coincided precisely with the midnight-to-dawn window when dense smoke trapped near the ground due to winter temperature inversion, the findings demonstrate that official averages substantially cushioned the true respiratory burden endured by millions of residents across the National Capital Region.
Why CPCB Stations Stopped Reporting: The 1,000-Microgram System Cap
The release of CREA’s study came just twenty-four hours after the Central Pollution Control Board issued a technical clarification explaining why real-time pollution graphs went blank across multiple neighborhoods on Diwali night. According to the central pollution regulator, particulate matter analyzers deployed across India under the National Air Quality Index (NAQI) framework—established in 2015—are calibrated to measure ambient concentrations strictly within a range of 0 to 1,000 µg/m³, corresponding to a maximum AQI score of 500.
When intense firecracker emissions cause localized PM2.5 concentrations to breach the 1,000 µg/m³ mark, the CPCB’s automated data validation software flags those readings as "out-of-range" anomalies and strips them out of public feeds. Crucially, the board confirmed that these excluded high-concentration hours are omitted entirely when computing a station's 24-hour rolling average. Environmental experts and public health researchers have criticized this algorithmic filtering, arguing that discarding the most toxic hours of the year creates an artificial statistical ceiling that masks acute health emergencies and weakens public health advisories.
DPCC Raw Data Reveals Extreme Hotspots: Mundka Hits 3,744 µg/m³
While central dashboards displayed blank cells during critical hours, uncalibrated raw telemetry later released by the Delhi Pollution Control Committee (DPCC)—which operates 43 of Delhi’s 60 air monitoring stations—exposed the staggering toxicity experienced at ground level. According to DPCC records, PM2.5 concentrations shattered the 1,000 µg/m³ threshold across wide swathes of the capital on Diwali night. At least 11 monitoring locations recorded hourly PM2.5 levels surpassing 2,000 µg/m³, while four neighborhoods breached the extraordinary 3,000 µg/m³ barrier—more than fifty times the national daily safety standard.
West Delhi’s industrial and residential hub of Mundka emerged as the worst-affected hotspot, where hourly PM2.5 concentrations rocketed to 3,744 µg/m³ at 2:00 AM on Monday—over 62 times higher than the 60 µg/m³ national benchmark. Despite this extreme spike, CPCB portals did not publish PM2.5 readings for Mundka between midnight and 4:00 AM. Similarly, South Delhi’s Jawaharlal Nehru University (JNU) station logged 3,023 µg/m³ at 4:00 AM, while NSUT West Campus recorded 3,008 µg/m³ at 5:00 AM, and Jahangirpuri spiked as high as 4,985 µg/m³ in real-time metrics. Other densely populated localities, including Mandir Marg, Nehru Nagar, and Wazirpur, all registered hourly concentrations exceeding 2,000 µg/m³ before dawn.
Rethinking Air Quality Metrics: Need for Emergency Grading Beyond 'Severe'
The discrepancy between raw DPCC telemetry and filtered CPCB averages has reignited calls among environmental scientists for modernizing India’s air quality reporting architecture. Because the current NAQI scale caps out at 500 and classifies any 24-hour PM2.5 average above 250 µg/m³ under the single umbrella of "severe," the system fails to differentiate between moderately severe winter smog and life-threatening chemical spikes exceeding 3,000 µg/m³. Environmental researchers warn that inhaling ultrafine PM2.5 particles at such extreme concentrations allows heavy metals and toxic combustion byproducts to penetrate deep into pulmonary alveoli and enter the bloodstream within minutes, posing immediate cardiac and respiratory dangers to children, the elderly, and asthma patients.
As winter meteorological conditions tighten across the Indo-Gangetic Plain—impacting not only Delhi-NCR but also downwind urban centers across Uttar Pradesh including Noida, Ghaziabad, Kanpur, and Lucknow—policy analysts stress that accurate, uncensored environmental data is the bedrock of effective public health protection. Upgrading sensor calibration limits and introducing an emergency "severe-plus" public health alert tier will ensure that citizens and hospitals receive transparent warnings whenever air toxicity crosses critical thresholds.